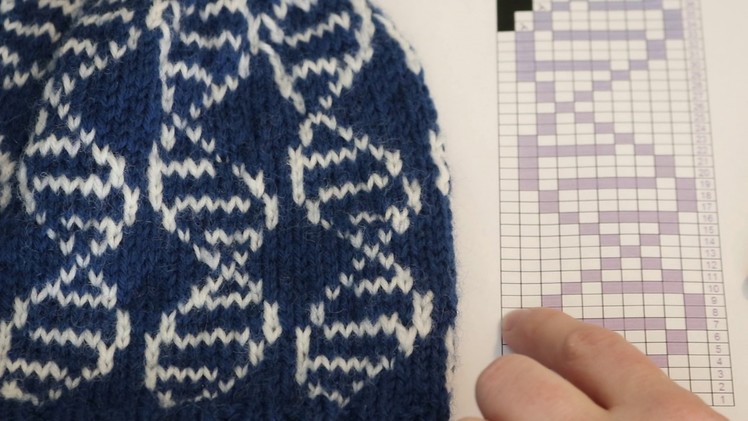
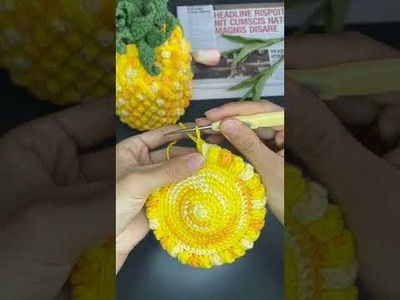
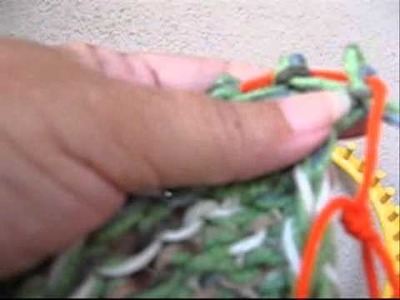
Knitting charts are a graphical representation of a knitting pattern. Different colors to represent the colored yarns in stranded colorwork or symbols to represent different knit stitches indicate what you do where instead of reading out a line of words.